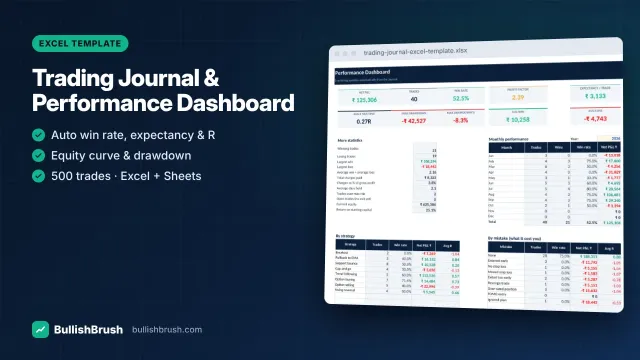
Trading Journal & Performance Dashboard (Excel / Google Sheets)
Log every trade once — win rate, profit factor, expectancy, R-multiples, drawdown and monthly P&L calculate automatically.
₹249
₹49950% off
View details
Automatically draws the strongest support and resistance zones, ranked by touches and sized by ATR — with breakout and breakdown alerts.
You save ₹500
🔒 Secure payment by Razorpay · UPI, cards, net banking
Tap any image to see it full-size — then zoom in to read every detail.
Stop redrawing lines every morning. This indicator finds swing highs and lows, merges them into zones, counts the touches and draws only the levels that matter.
ZIP download: .pine source + PDF guide. Works on free and paid TradingView plans. Instant download after payment — available any time in your account.
Educational tool. Not investment advice.
UPI, cards or net banking — checkout takes under a minute.
Your download appears in your account immediately, and the link is emailed to you.
Open the file and follow the built-in “Start here” guide.
Right after payment the download appears in your account, and a download link is also sent to your email. No waiting.
A ZIP file with the TradingView Pine Script source code, a step-by-step PDF guide and a read-me. Paste the code into TradingView’s Pine Editor and add it to your chart in about two minutes.
The licence is for your own personal or internal business use. Sharing or reselling the file is not allowed.
No. All our products are for education. They do not recommend buying or selling anything, and trading always involves risk of loss.
Message us on WhatsApp or email — a real person will help you set it up.
No reviews for this product yet. Read our Google reviews
BullishBrush provides stock market education only. We are not a SEBI-registered investment adviser or research analyst and do not give buy/sell recommendations or tips. Investments in securities markets are subject to market risks; read all related documents carefully before investing. Past performance does not guarantee future results.
Log every trade once — win rate, profit factor, expectancy, R-multiples, drawdown and monthly P&L calculate automatically.
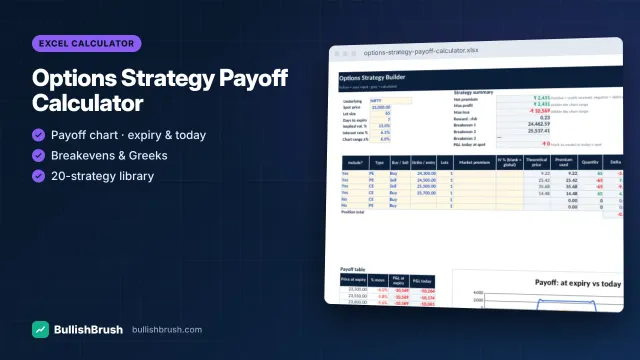
Build any strategy with up to 6 legs and see payoff at expiry and today, breakevens, max profit/loss and Greeks.
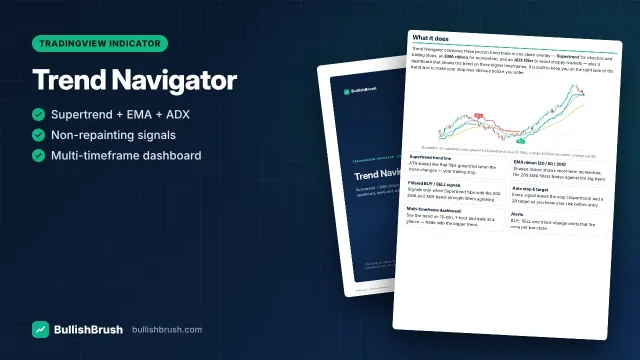
Supertrend, EMA ribbon and ADX filter in one overlay, with filtered BUY/SELL signals, auto stop/target and a multi-timeframe dashboard.
AI assistant — education only, not investment advice · WhatsApp