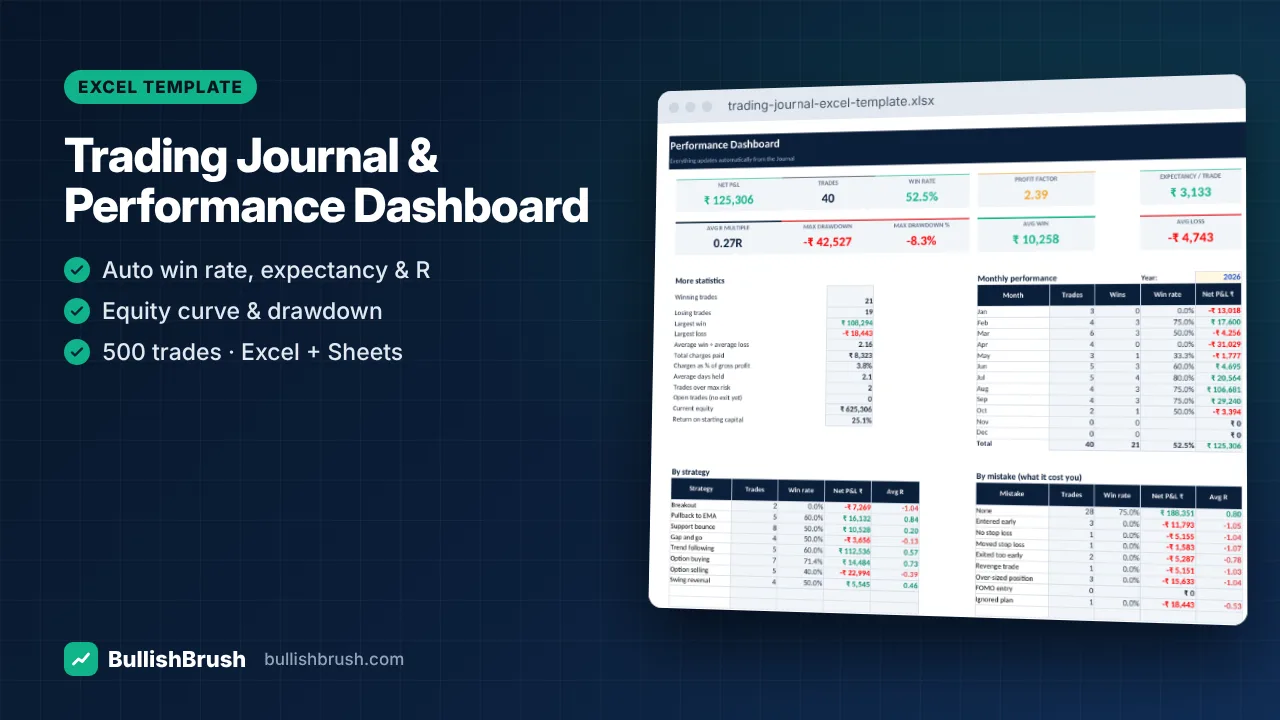
Trading Journal & Performance Dashboard (Excel / Google Sheets)
Log every trade once — win rate, profit factor, expectancy, R-multiples, drawdown and monthly P&L calculate automatically.
₹249
₹49950% off
View details
Build any strategy with up to 6 legs and see payoff at expiry and today, breakevens, max profit/loss and Greeks.
See exactly how an options trade makes or loses money before you place it. Enter up to six legs — calls, puts or futures — and the sheet draws the payoff, finds the breakevens and calculates the Greeks.
Prices and Greeks use the standard Black-Scholes model; results were cross-checked against an independent calculation. Margin is not calculated — use your broker's margin calculator.
Works in Microsoft Excel (2010 or later), Google Sheets and LibreOffice Calc. Instant download after payment — available any time in your account.
No reviews for this course yet. Read our Google reviews
BullishBrush provides stock market education only. We are not a SEBI-registered investment adviser or research analyst and do not give buy/sell recommendations or tips. Investments in securities markets are subject to market risks; read all related documents carefully before investing. Past performance does not guarantee future results.
Join a free demo class or message us — we will help you choose the right course.
Free Demo Class WhatsAppLog every trade once — win rate, profit factor, expectancy, R-multiples, drawdown and monthly P&L calculate automatically.
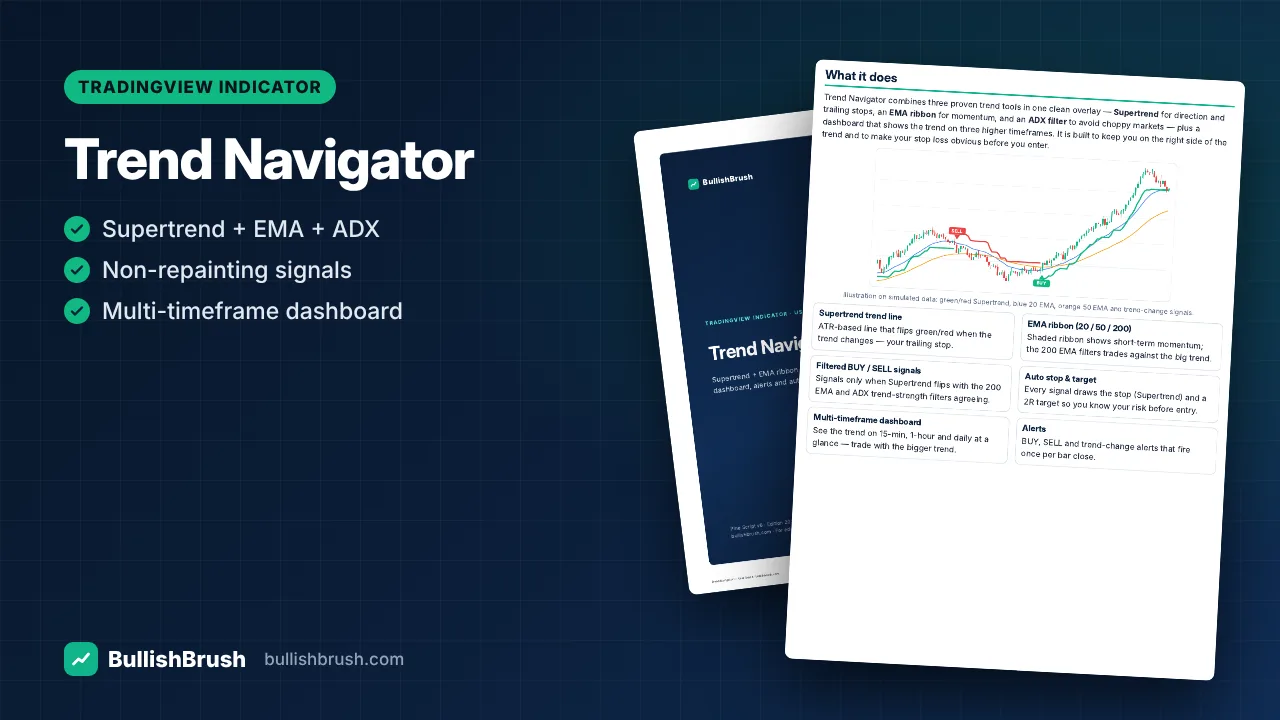
Supertrend, EMA ribbon and ADX filter in one overlay, with filtered BUY/SELL signals, auto stop/target and a multi-timeframe dashboard.
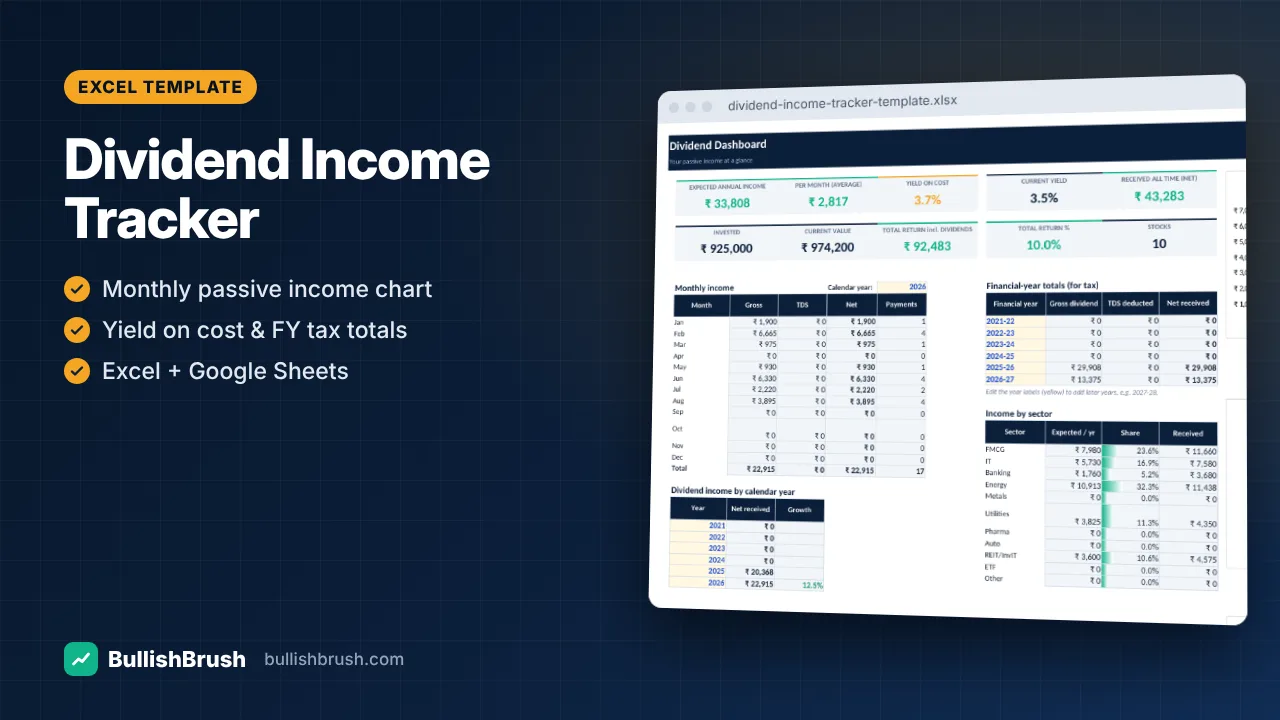
Track every dividend, yield on cost and passive income by month, financial year, stock and sector.