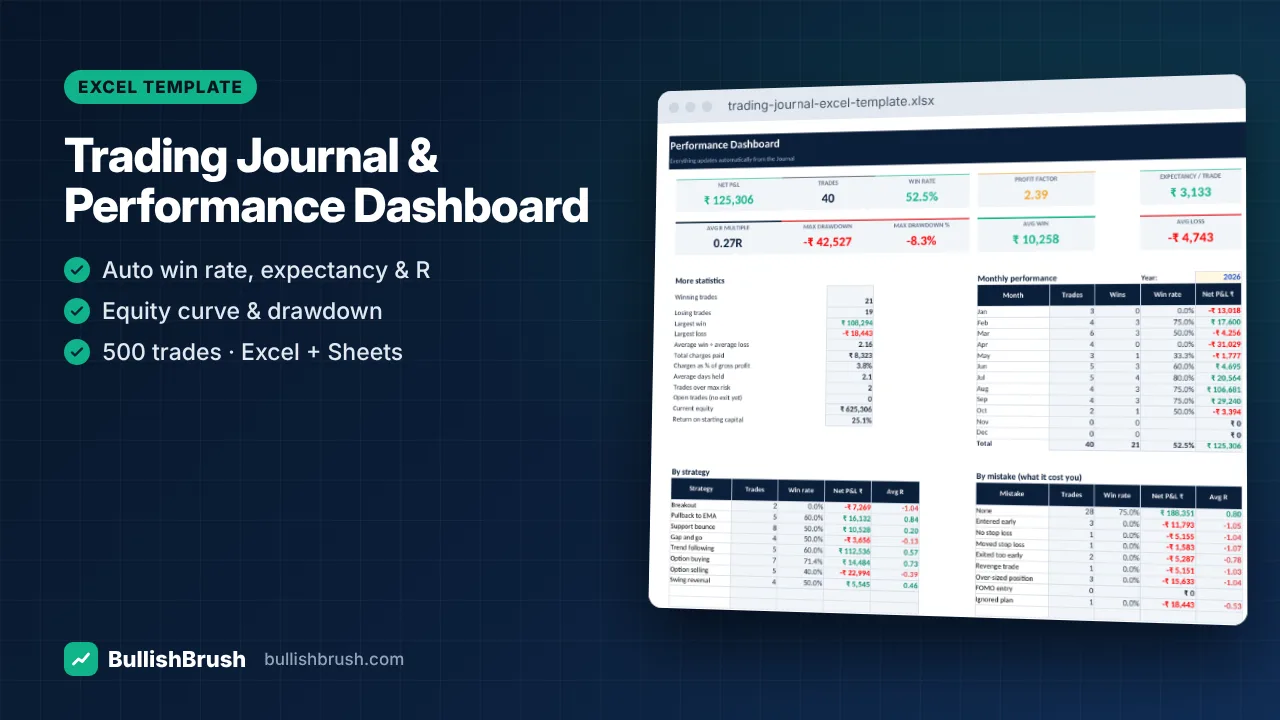
Trading Journal & Performance Dashboard (Excel / Google Sheets)
Log every trade once — win rate, profit factor, expectancy, R-multiples, drawdown and monthly P&L calculate automatically.
₹249
₹49950% off
View details
Track every dividend, yield on cost and passive income by month, financial year, stock and sector.
Watch your passive income grow. Enter your holdings and log each dividend as it arrives — the tracker shows your income by month and financial year, yield on cost, sector split and total return including dividends.
Works in Microsoft Excel (2010 or later), Google Sheets and LibreOffice Calc. Instant download after payment — available any time in your account.
No reviews for this course yet. Read our Google reviews
BullishBrush provides stock market education only. We are not a SEBI-registered investment adviser or research analyst and do not give buy/sell recommendations or tips. Investments in securities markets are subject to market risks; read all related documents carefully before investing. Past performance does not guarantee future results.
Join a free demo class or message us — we will help you choose the right course.
Free Demo Class WhatsAppLog every trade once — win rate, profit factor, expectancy, R-multiples, drawdown and monthly P&L calculate automatically.
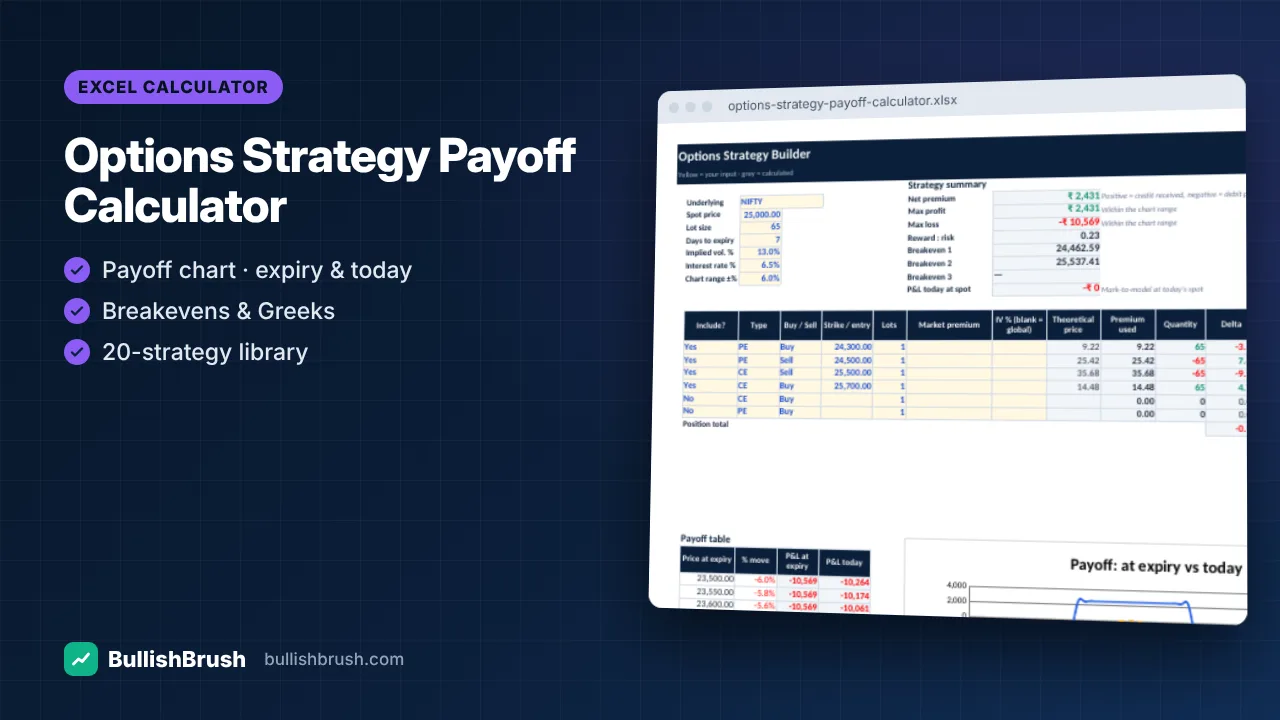
Build any strategy with up to 6 legs and see payoff at expiry and today, breakevens, max profit/loss and Greeks.
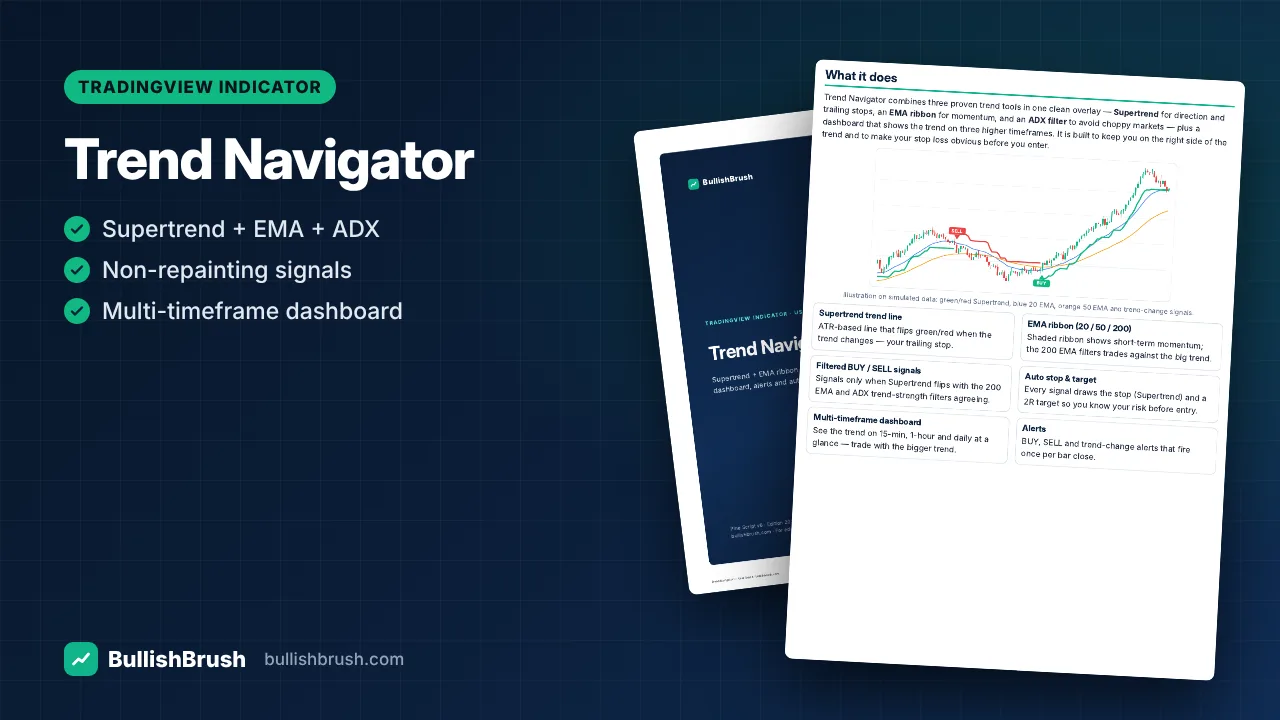
Supertrend, EMA ribbon and ADX filter in one overlay, with filtered BUY/SELL signals, auto stop/target and a multi-timeframe dashboard.