Trading Journal & Performance Dashboard (Excel / Google Sheets)
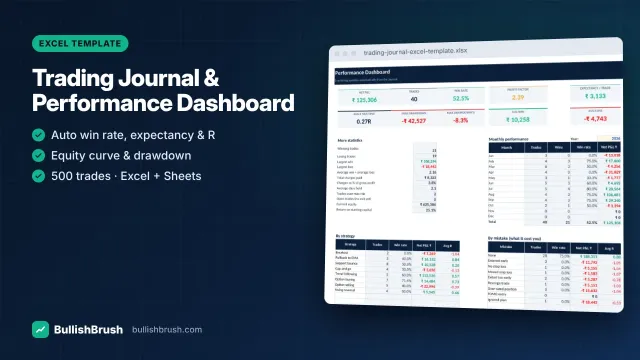
Log every trade once — win rate, profit factor, expectancy, R-multiples, drawdown and monthly P&L calculate automatically.
₹249
₹49950% छूट
विवरण देखें
Compound growth with deposits and withdrawals, a full schedule, goal solver, plan-vs-actual tracker and a reality check on returns and drawdown recovery.
आपकी बचत ₹150
🔒 Razorpay से सुरक्षित पेमेंट · UPI, कार्ड, नेट बैंकिंग
किसी भी इमेज पर टैप करें — बड़ा करके हर डिटेल पढ़ें।
See what consistent returns really compound to — and why 'just 1% a day' is a red flag, not a plan.
Works in Microsoft Excel (2010 or later), Google Sheets and LibreOffice Calc. Currency-neutral — use dollars, pounds, euros or any currency. Instant download after payment — available any time in your account.
UPI, कार्ड या नेट बैंकिंग — एक मिनट में पेमेंट।
डाउनलोड तुरंत आपके अकाउंट में आएगा, लिंक ईमेल पर भी।
फ़ाइल खोलें और अंदर की “Start here” गाइड फ़ॉलो करें।
पेमेंट के तुरंत बाद डाउनलोड आपके अकाउंट में आएगा, और डाउनलोड लिंक ईमेल पर भी भेजा जाएगा।
Microsoft Excel 2010 or later, or the free Google Sheets (upload to Google Drive → Open with Google Sheets) or LibreOffice Calc. No macros or add-ins are needed.
Yes — open it in the free Excel or Google Sheets app. Entering lots of data is easier on a computer, but you can check your numbers anywhere.
The licence is for your own personal or internal business use. Sharing or reselling the file is not allowed.
नहीं। हमारे सभी प्रोडक्ट शिक्षा के लिए हैं। ये कुछ खरीदने या बेचने की सलाह नहीं देते, और ट्रेडिंग में हमेशा नुकसान का जोखिम होता है।
WhatsApp या ईमेल पर मैसेज करें — हम खुद सेटअप में मदद करेंगे।
इस प्रोडक्ट का अभी कोई रिव्यू नहीं है। Google रिव्यू पढ़ें
BullishBrush केवल शेयर बाज़ार की शिक्षा देता है। हम SEBI-रजिस्टर्ड निवेश सलाहकार या रिसर्च एनालिस्ट नहीं हैं और कोई खरीद-बिक्री की सलाह या टिप्स नहीं देते। शेयर बाज़ार में निवेश बाज़ार जोखिमों के अधीन है; निवेश से पहले सभी दस्तावेज़ ध्यान से पढ़ें। पिछला प्रदर्शन भविष्य की गारंटी नहीं है।
Log every trade once — win rate, profit factor, expectancy, R-multiples, drawdown and monthly P&L calculate automatically.
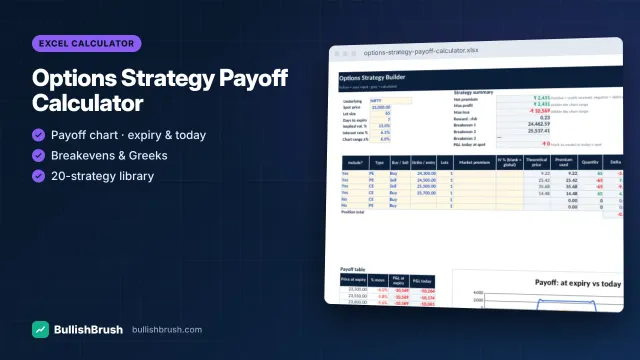
Build any strategy with up to 6 legs and see payoff at expiry and today, breakevens, max profit/loss and Greeks.
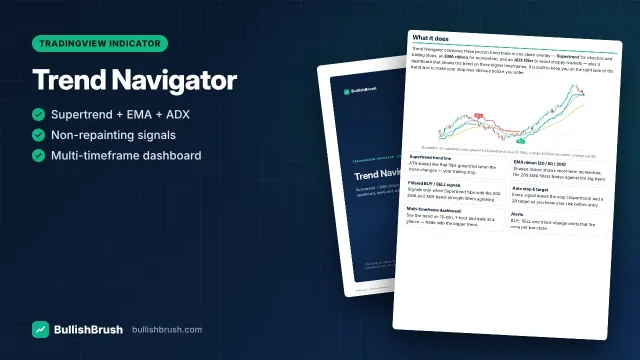
Supertrend, EMA ribbon and ADX filter in one overlay, with filtered BUY/SELL signals, auto stop/target and a multi-timeframe dashboard.
AI असिस्टेंट — सिर्फ़ शिक्षा के लिए, निवेश सलाह नहीं · WhatsApp