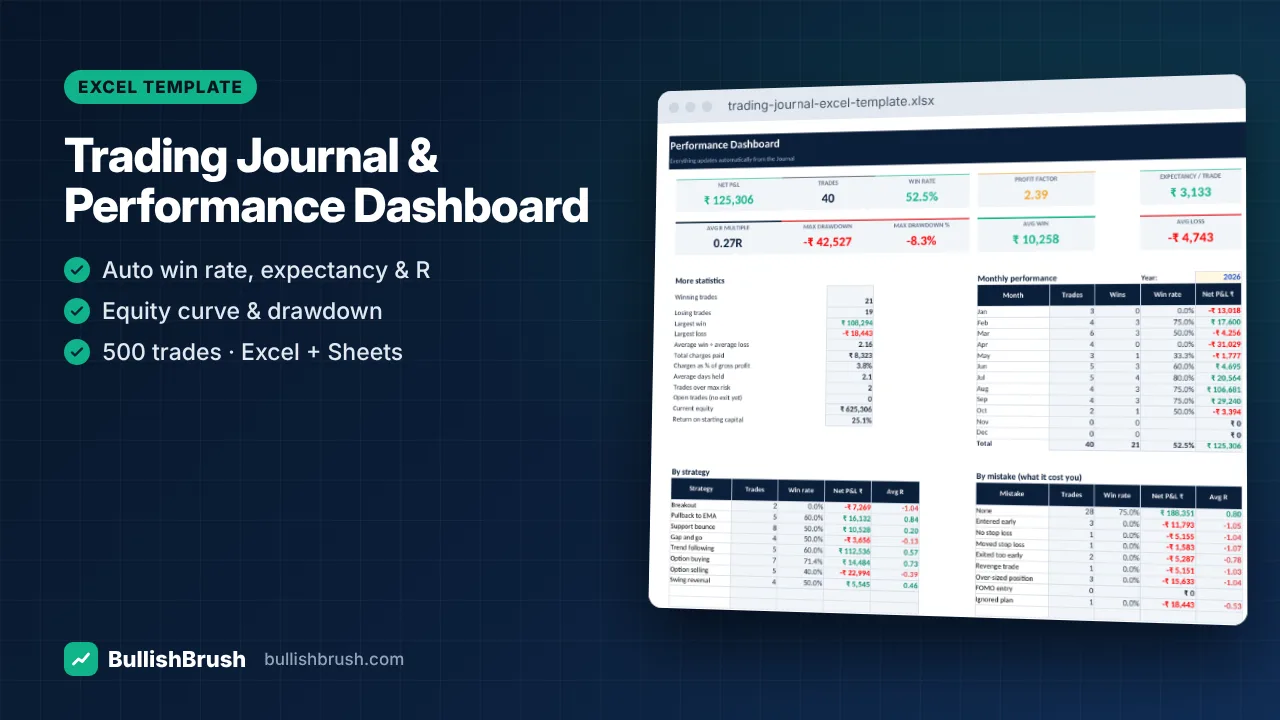
Trading Journal & Performance Dashboard (Excel / Google Sheets)
Log every trade once — win rate, profit factor, expectancy, R-multiples, drawdown and monthly P&L calculate automatically.
₹249
₹49950% छूट
विवरण देखें
Know exactly how many shares, lots or forex lots to trade — for stocks, crypto, F&O, option buying and forex.
The single most important number in trading is your position size. This calculator gives it to you in seconds — and shows why risking 1% instead of 5% keeps you in the game.
Works in Microsoft Excel (2010 or later), Google Sheets and LibreOffice Calc. Instant download after payment — available any time in your account.
इस कोर्स का अभी कोई रिव्यू नहीं है। Google रिव्यू पढ़ें
BullishBrush केवल शेयर बाज़ार की शिक्षा देता है। हम SEBI-रजिस्टर्ड निवेश सलाहकार या रिसर्च एनालिस्ट नहीं हैं और कोई खरीद-बिक्री की सलाह या टिप्स नहीं देते। शेयर बाज़ार में निवेश बाज़ार जोखिमों के अधीन है; निवेश से पहले सभी दस्तावेज़ ध्यान से पढ़ें। पिछला प्रदर्शन भविष्य की गारंटी नहीं है।
फ्री डेमो क्लास में आएँ या मैसेज करें — सही कोर्स चुनने में मदद करेंगे।
फ्री डेमो क्लास WhatsAppLog every trade once — win rate, profit factor, expectancy, R-multiples, drawdown and monthly P&L calculate automatically.
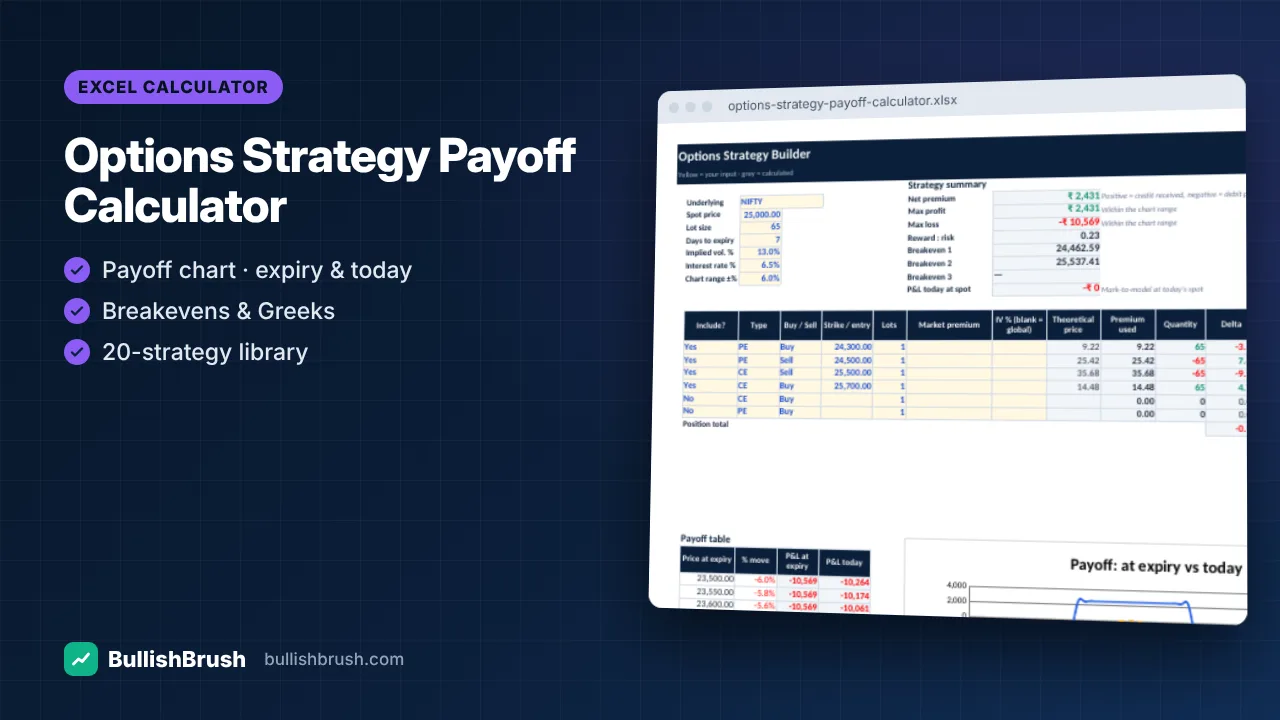
Build any strategy with up to 6 legs and see payoff at expiry and today, breakevens, max profit/loss and Greeks.
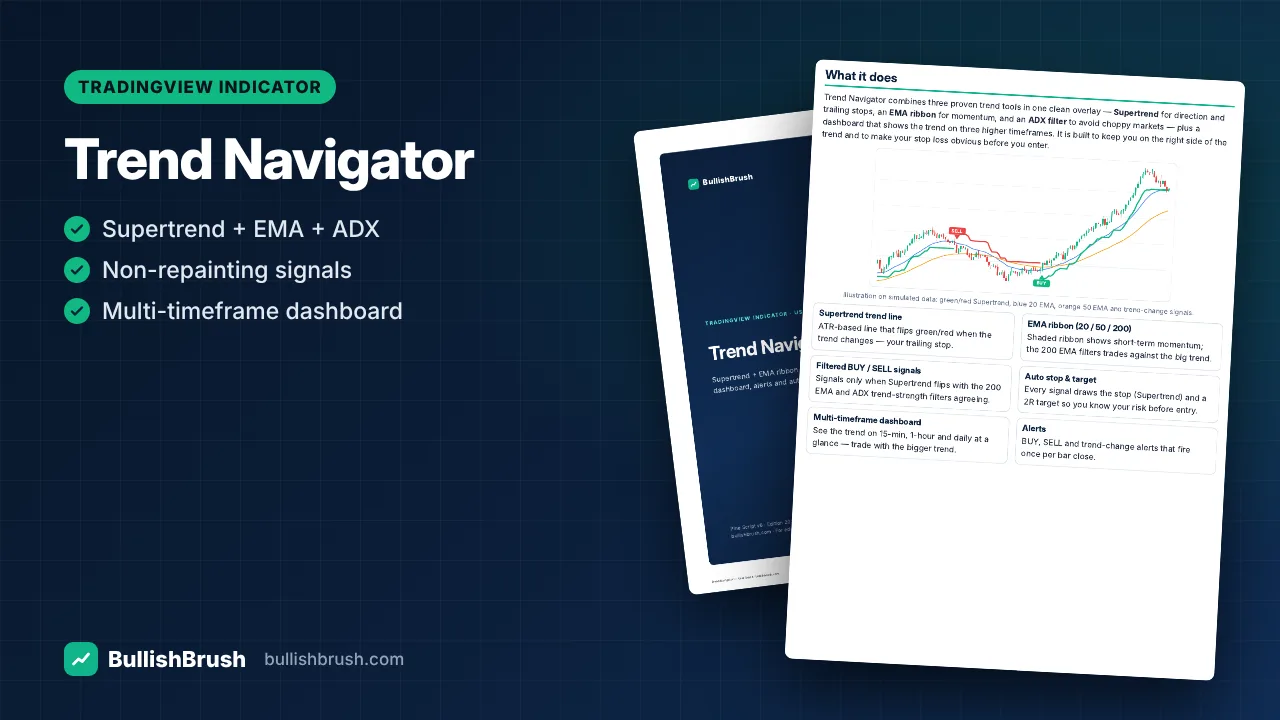
Supertrend, EMA ribbon and ADX filter in one overlay, with filtered BUY/SELL signals, auto stop/target and a multi-timeframe dashboard.